
Pinterest Analytics offers an incredible suite of tools for its power Pinners and content creators. The best part? Insights are available for organic content, not just paid ads.
Because Pinterest is not your average social media site, the analytics it offers are anything but ordinary (in fact, many Pinterest experts say it’s not social media at all). Unlike most social media sites, it delivers super valuable insights via numerous charts and metrics.
But with so much on offer, it can be overwhelming to know what to look for.
In this post, we cover which metrics are important, how to track them, and how to make smarter decisions and achieve your goals for audience growth and traffic acquisition.
Where to Find Pinterest Analytics
Similar to YouTube, Pinterest provides incredibly in-depth analytics. Doing so encourages content creators to create better content, which in turn serves Pinterest’s audience and helps them grow and retain their base of Pinners.
In order to access Pinterest Analytics, you’ll need to convert your Pinterest profile into a business account, if it isn’t already.
Now that you’ve got a business account, you can view five different Pinterest Analytics tools for free. Each one offers different information and insights. When you’re logged into Pinterest, simply hover over Analytics and click on each from the drop-down menu.
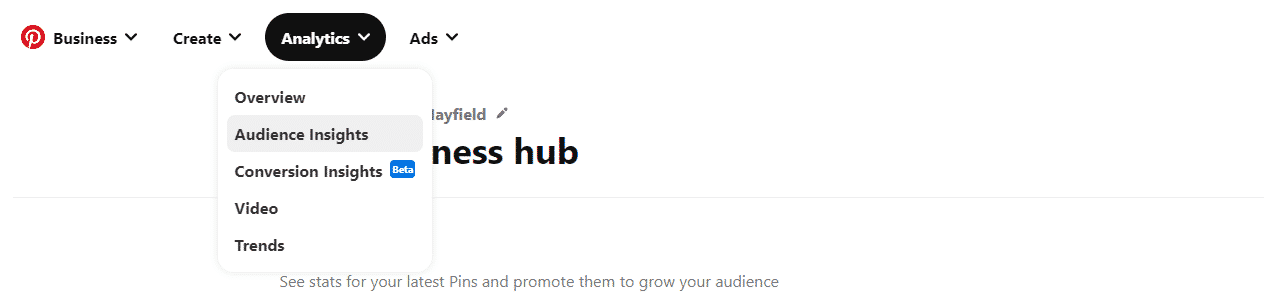
Here’s what you can find in these tools (in the following sections of this Pinterest Analytics guide, we’ll dive deeper into what all of these metrics mean for your business):
Overview
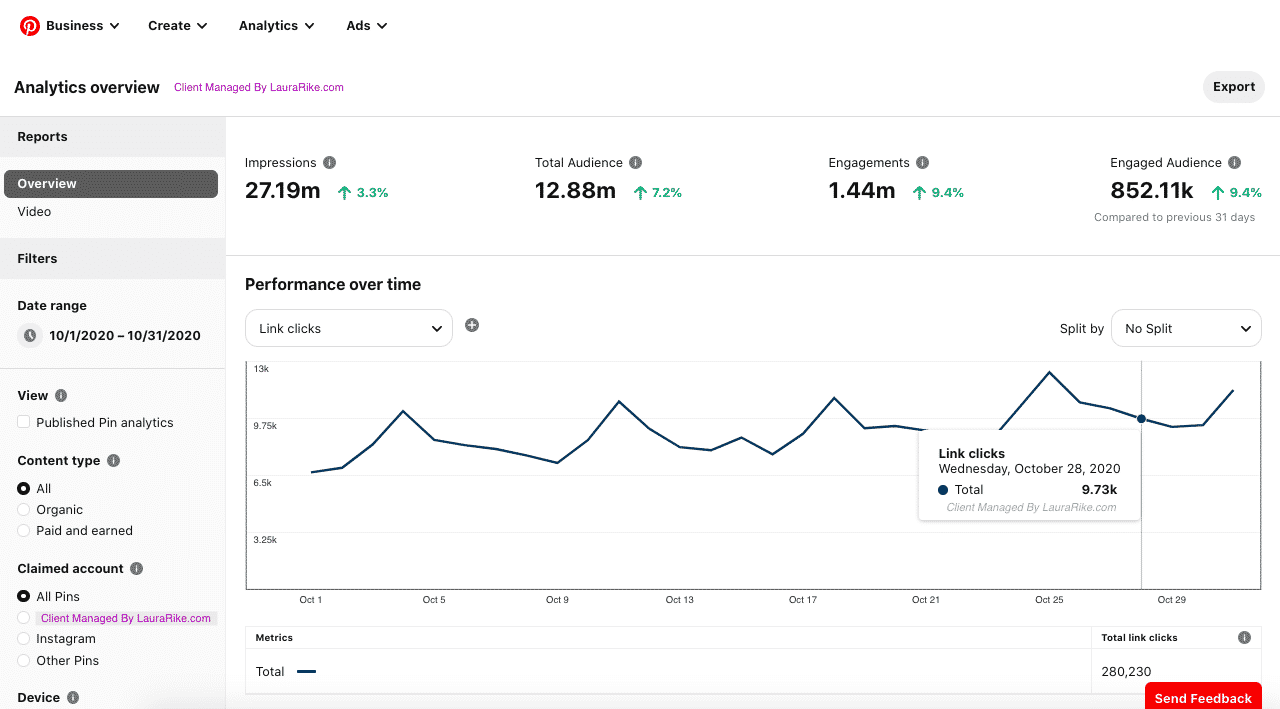
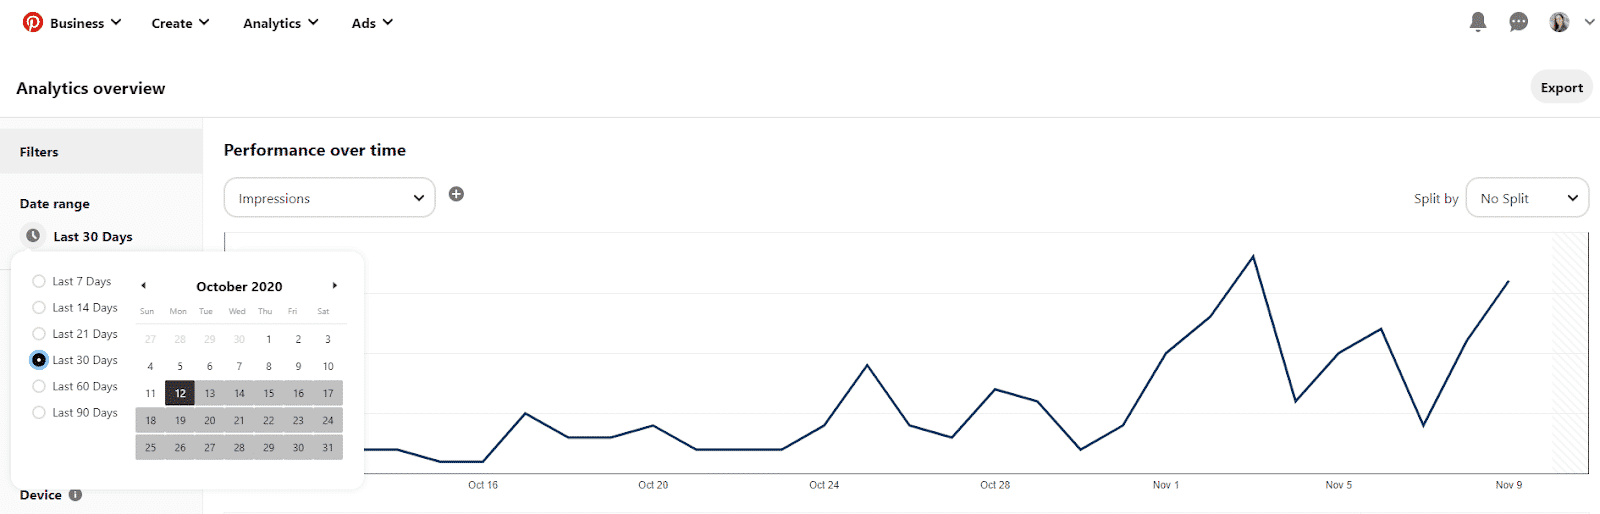
In the Overview section of Pinterest Analytics, you can discover your monthly impressions, total followers, your engagements, and your engaged audience. You can filter these metrics out by date range, device type, and more.
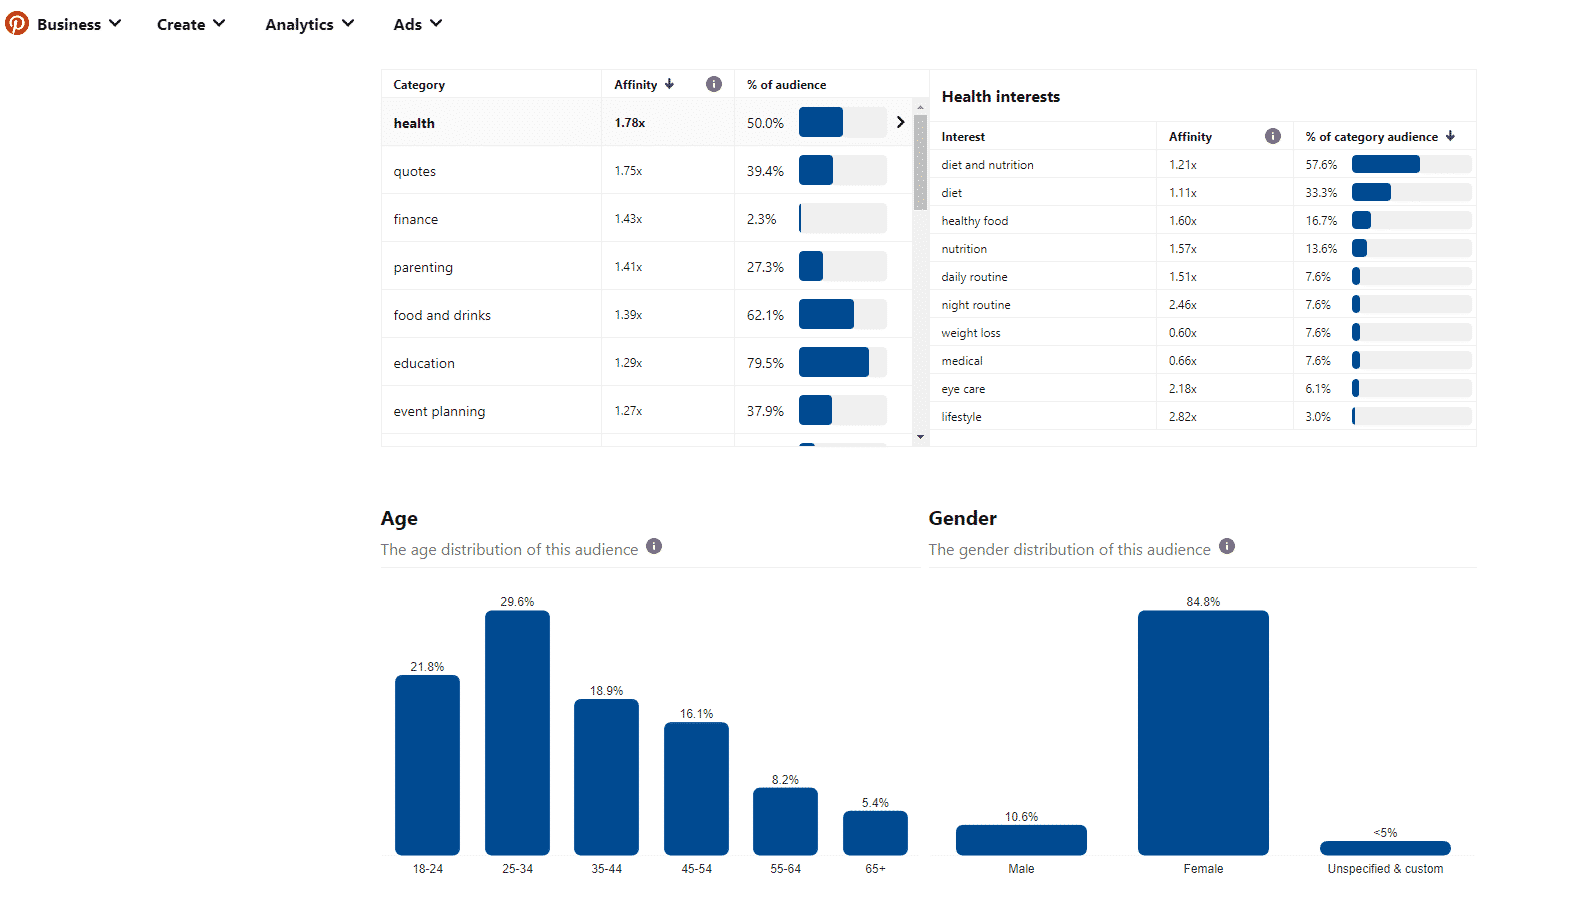
Audience Insights
In the Audience Insights dashboard, you can learn a bit more about what your audience cares about and their demographic information. If you’re considering creating content in other subtopics, this can help you learn how to diversify your content strategically.
Conversion Insights
With Conversion Insights, you can find out the impact of both your organic content and your paid content in terms of your campaign goals (most commonly clicks, page visits, or shopping cart conversions).
Video
If you guessed that the Video section on Pinterest Analytics provides insights into how your video pins perform, you’d be right. This dashboard view pulls data from your video pins to provide more details on play time and engagement.
Because video content is more time consuming to create than typical pin graphics, Pinterest Analytics provides content creators with video-specific insights to help them better allocate their time and resources.
“With one of my clients, we added video to her pinning strategy which spiked her impressions and engagements,” says Allie Billings, Pinterest management expert about her work with Fiona Wong’s Pinterest account The Wild Pixel, which has rapidly grown to 355,000 monthly viewers.
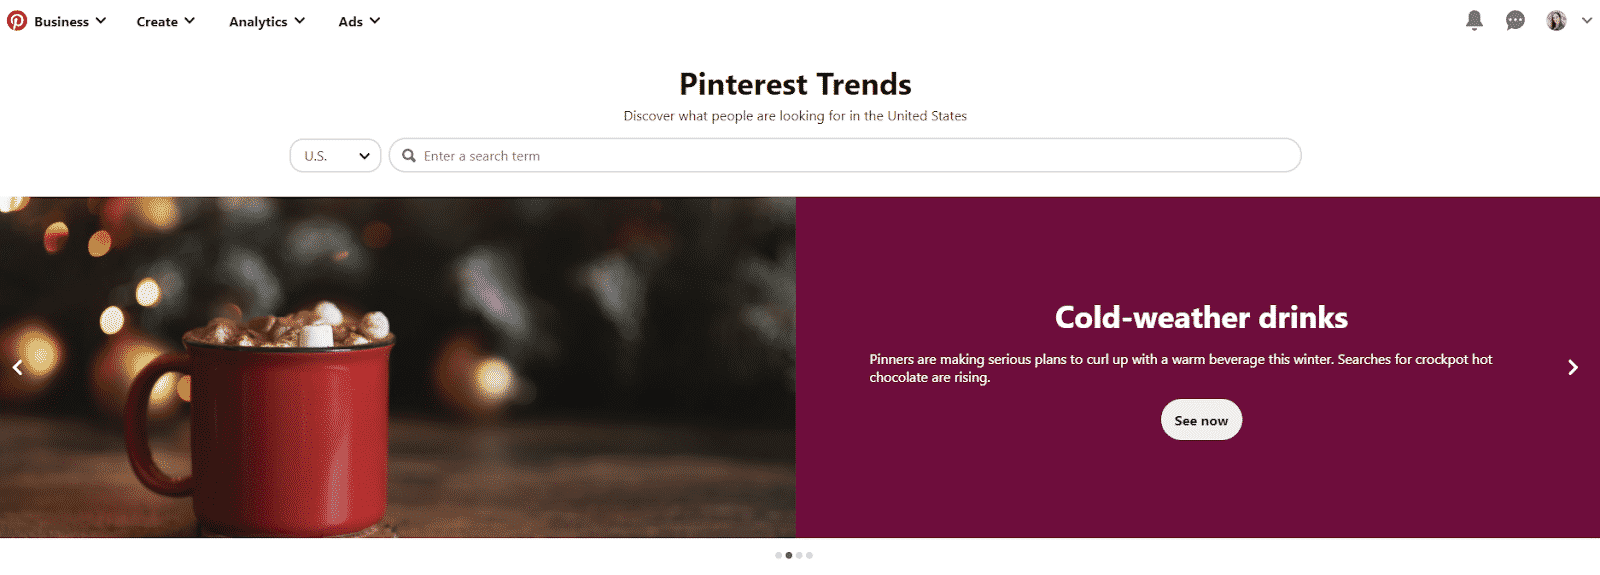
Trends
Want to add a trendy spin to your upcoming content?
Inside of Pinterest Trends, you can discover the top searches by all Pinners in large markets (the US, UK, and Canada). Even if your business is B2B and not B2C, you can still use this information to get fun ideas for your content. For example, you could make a pin for “cold-weather office gear” instead of “cold-weather drinks.”
How to Use Pinterest Analytics Based on Your Unique Goals
Now that we understand where to find Pinterest Analytics data, let’s explore how we can use this information.
In the following sections, we’ll learn about the top metrics, how to track changes, and how to make data-driven decisions when it comes to Pinterest marketing. But the first step is to determine your top goals for Pinterest.
These are the two most common goals for Pinterest marketing:
Driving traffic
The majority of small businesses use Pinterest to drive traffic to their blog posts, YouTube videos, other longform content, freebies, landing pages, product pages, etc. If traffic is your main goal for using Pinterest, then you’ll want to pay the most attention to your link clicks, engagements, top Pins, and top boards.
Brand awareness
Larger B2C brands that serve the core Pinterest demographic (Millennial, Gen X, and Boomer women) will often use Pinterest for brand awareness. If that’s your top goal, then you might track followers, impressions, and total audience than link clicks.
Top Metrics to Pay Attention To (And What they Mean)
“The most important thing to look at is link clicks,” says Laura Rike, a Pinterest strategist who works primarily with service providers who use Pinterest to drive traffic. “The other metrics are more like vanity metrics, and won’t necessarily deliver the leads and sales you’re looking for.”
Since the majority of business owners use Pinterest to drive traffic to their websites, it’s no wonder that link clicks from pins to website properties is such a key metric. Below, we explore this metric and all of the other ones that you’ll want to pay attention to.
Link Clicks
- What this metric is: This metric reveals the number of times someone clicked from your pin through to whatever you were linking out to (your website, Etsy store, YouTube channel, etc.). This metric is most commonly reviewed weekly, monthly, and quarterly.
- Why it matters: While some businesses are more focused on brand awareness and visibility, many companies utilizing Pinterest do so to drive traffic. This metric is typically regarded as the best way to track how successful your overall Pinterest account is at delivering traffic to your important posts and pages.
- What to look for: There will be spikes in activity, so don’t get too excited about those. Instead, look for growth of at least 10% month over month.
One of Laura’s clients is getting a quarter of a million link clinks in a single month, and you can see that even within that month, the growth is trending upwards.
Followers
- What this metric is: This shows you the total number of followers for a given time period.
- Why it matters: Unlike other social media platforms, your number of followers on Pinterest is not the end-all, be-all metric. You can still get high impressions and link clicks without millions of followers. However, this is still an important metric to pay attention to, because as it grows, you should also see growth with metrics that matter more, such as engagement and link clicks.
- What to look for: Because followers aren’t essential to getting high amounts of impressions and link clicks (that’s what Pinterest SEO is for), you don’t need to worry about this metric, but it should be trending upward. If you aren’t gathering new followers each month, then you might need to question the quality of your content.
Impressions
- What this metric is: Your total impressions for a month (or any given time period) reveal how many times your pins were shown in the home feed.
- Why it matters: Your impressions reveal how well your pin optimization is working. If this number isn’t growing, then you won’t be able to achieve higher link clicks either.
- What to look for: If your impressions aren’t growing at a rate of at least 10% month over month, you should consider better optimizing your pin content and images for SEO.
Engagements
- What this metric is: An engagement encompasses several things, and is not like other social platforms. On Pinterest, engagement refers to clicking on a Pin in your feed or board to view it in more detail and/or saving this pin.
- Why it matters: While link clicks are ultimately the most important metric for content creators, you still want to keep track of engagements, because if no one is engaging with your content, they won’t click through to your website either. Engagements can also show you the popularity and virality of individual Pins.
- What to look for: You want your engagements to be growing at a rate of at least 5% or 10% per month (if not much higher), because this tells you that your content and SEO strategy is taking your account in the right direction. You also want to see a similar rate of growth with your engagements and your link clicks, because if your engagements are growing faster than link clicks, then your content isn’t strong enough to pull people off the Pinterest platform and onto your website.
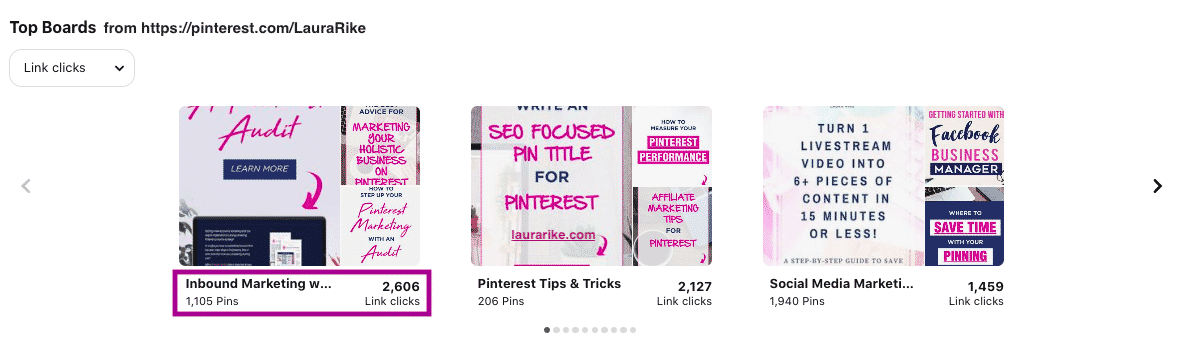
Top Boards
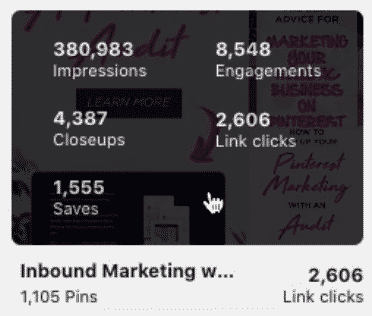
- What this metric is: Your top boards show you which boards are the most effective. You can pull up top boards based on impressions, engagements, link clicks, closeups (when someone clicks your pin to view it in detail), and saves.
- Why it matters: By discovering your top boards, you can find out what types of content you should make more of, and also analyze why this board is performing well and how you can better optimize your other existing boards.
- What to look for: Assuming your goal for using Pinterest is to drive traffic to your website, filtering top boards by link clicks will yield the most useful analysis.
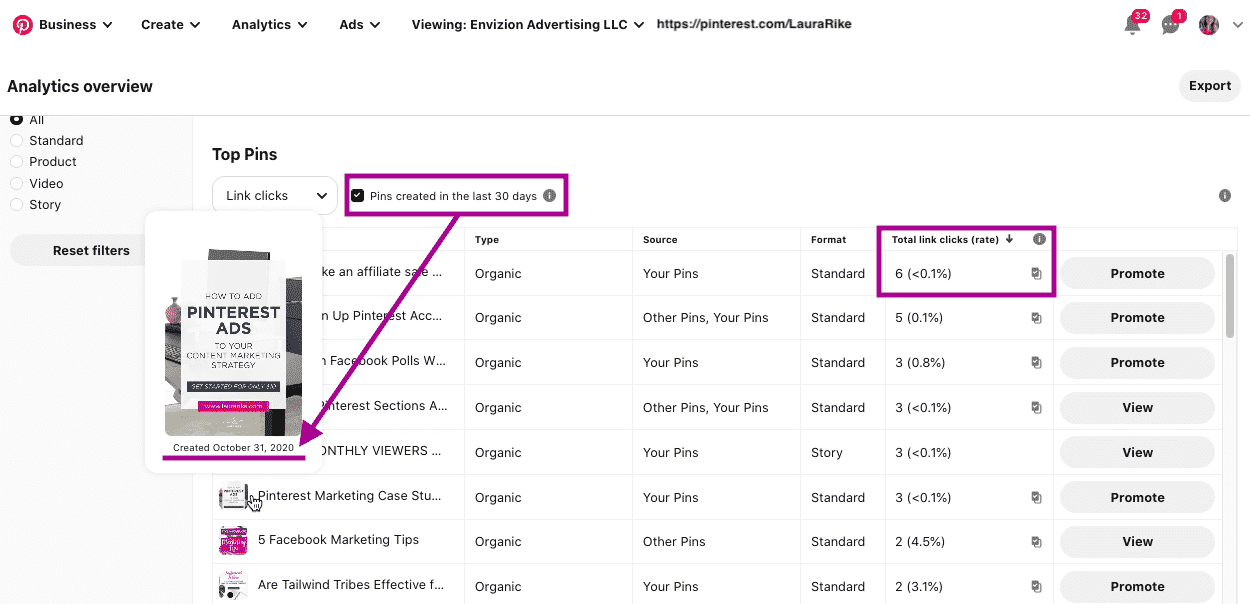
Top Pins
- What this metric is: Which of your Pins works the best? Find out which Pins get the most impressions, engagements, link clicks, closeups, and saves.
- Why it matters: While you can also find top-viewed posts in Google Analytics, top pins by link clicks especially offers a quick and easy way to find out what is getting traffic. This is also useful for sending traffic to Etsy or YouTube, where you don’t have access to Google Analytics traffic reports.
- What to look for: At the end of every week and every month, review your top Pins of all time, as well as your top pins from the past 30 days by link, clicks to uncover which pins deliver the most traffic to your website. Use this to create similar content, and consider promoting these Pins as well.
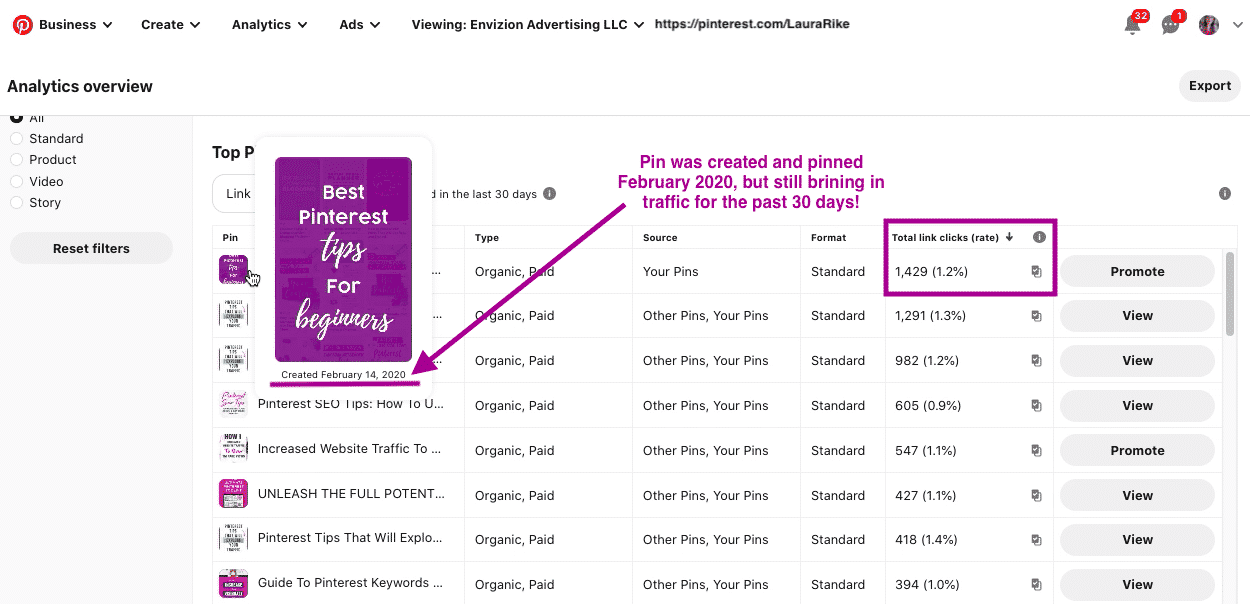
For Laura’s account, we can see that even Pins that are several months old can still bring in tons of website traffic. It’s important to see your best Pins for both new content and old content alike so you know exactly what’s working for you.
Total Audience
- What this metric is: Your total audience is the number of people who have seen your Pins or engaged with your pins.
- Why it matters: “I like to look at total audience and engaged audience as the primary metrics I shoot for,” says Allie. These metrics give you a sense of how your audience is growing despite your follower count and they’re related to higher engagements and link clicks.
- What to look for: If your strategy is working, you’ll want to see these metrics grow, because the larger your audience, the higher your brand awareness and your chances of driving website traffic, leads, and sales.
Engaged Audience
- What this metric is: This shows you how many people have engaged with your Pins in a given month, regardless of whether they’re a follower or not.
- Why it matters: Particularly if your goal is visibility and brand awareness, growing your engaged audience can be an important metric to track. If your goal is primarily website traffic, it may not be as essential but it can still offer insights into your growing reach.
- What to look for: If you’re actively pinning every day, you should see a growth of at least 10% every month. If not, you might need to revisit your strategy and the quality of your content.
How to Keep Track of Changes in Your Pinterest Metrics
About 80% of Laura’s business is managing Pinterest accounts for her clients, with the rest of her revenue coming from Pinterest training and coaching. Both for her own business and for her clients, she advocates restraint when it comes to checking analytics on Pinterest. “I try not to log in more than once a week and I highly suggest that for others as well. The reason being is a lot of people get caught up in the metrics being really high one day and then the next day they go down,” Laura says.
Instead of getting caught up in the rollercoaster, Laura recommends the following approach. “Typically for my clients and my own account, I will look on Fridays and then take a screenshot each week just so then at the end of the month I can compare the overall growth and understand what I need to change.” Laura also maintains a Google Sheet for herself and her clients, so she can add important metrics at the end of every month.
Here are the top ways to keep track of changes and monitor growth:
- Weekly screenshots – Take a screenshot of the Overview section every Friday, and drop it in a Google Doc so you can review the changes at the end of the month.
- Monthly reports – Document the link clicks, followers, impressions, and engagement stats from that month at the end of every month in a Google Sheet. Use a percentage change formula inside of Google Sheets to calculate the growth in these metrics from one month to the next.
Keep one Google Doc with screenshots for each month, and one tab in your Google Sheet for each year. This way, you can go back in time to analyze changes.
Of course, inside Pinterest Analytics, you can update the date range to hone in on a period of time you want to analyze, but maintaining these two resources described above will make it easier to quickly and visually compare time periods side by side.
You can also watch out for differences in engagement and link clicks for pin variations. Allie explains, “When I am running a campaign for something specific, let’s say it’s running to someone’s opt-in, I’ll design two or three different images. So a lot of the time I’ll analyze the Pin design and say, ‘Okay, I think that this design is not performing well. So let’s walk that out.’”
If you’re running any design tests, just make a note at the top of your Google Doc for that month about the Pins, and check the success of the variations weekly to determine a winner.
Pinterest Analytics has tons to offer business owners, so set your goals, fine-tune your strategy, and start tracking everything.
Did you know? MeetEdgar integrates with Pinterest to help you drive more traffic to your posts and pages. We put together an easy-to-follow 5-day Pinterest challenge to help you supercharge your Pinterest strategy. Sign up for the Perfect Pin Plan for free here!