7 useful Excel formulas and functions for PPC
Use these tips to quickly analyze performance data and identify high-impact PPC optimizations that will move the needle.
My approach to PPC is analytical. I realized early in my career that if I focused on developing my ability to manipulate and interpret performance data, the optimizations become obvious.
Leaning into Excel skills can help you become a more efficient worker and improve the quality of your analyses.
One of my favorite parts about Excel is that I continuously find ways to be more efficient. Several functions and formulas can help expedite PPC tasks.
What follows are seven Excel tips to help you quickly identify high-impact PPC optimizations that will move the needle for your brand or client.
Excel 101: Foundational formulas
These are the Excel skills I first introduce to new hires who are expected to take on performance reporting and bulk sheet builds.
If you find yourself in a similar role or feel that those tasks are cumbersome, try incorporating the following into your process.
Delta
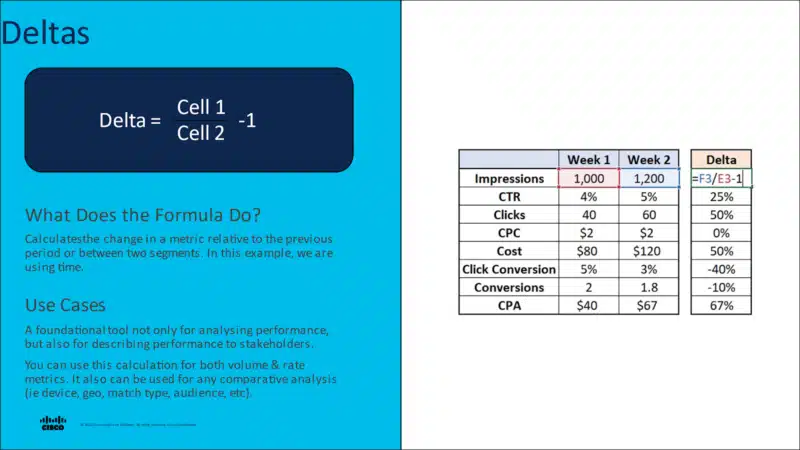
Simply put, a delta is a rate of change. For performance marketers, that is half the battle associated with our jobs. We need to have an acute understanding of the changes we see to develop effective optimizations.
Notice how large the Click Conversion Delta is in the example calculation above. Nominally, a drop from 5% to 3% could be overlooked. However, using the delta calculation, it becomes clear that click conversion needs to improve, to enhance the campaign CPA.
Incremental impact
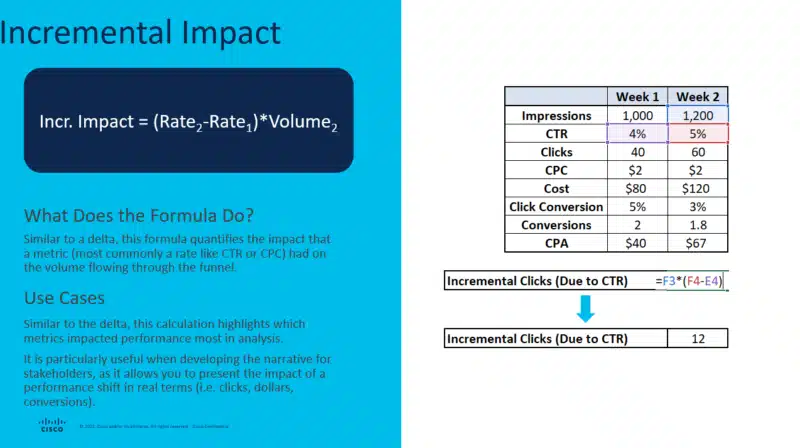
The insights received from the incremental impact calculation will align with the insights from the performance deltas – big deltas will have big incremental impacts. Don’t expect to get any new insights when using these formulas in conjunction.
This formula is handy when developing a performance narrative. It helps answer the “so what” question that all stakeholders understand. Incorporate callouts such as “an X% drop in CTR results in Y fewer clicks” or “an X% increase in CPCs drove $Y more spend” to add more color to the narrative.
One important caveat is that this formula assumes that all else is constant. As marketers, we know that these metrics are all interconnected.
If impressions increase by 50%, CTR will likely decrease. Use deltas first to understand performance changes comprehensively, and only leverage this calculation when it makes logical sense.
Concatenate
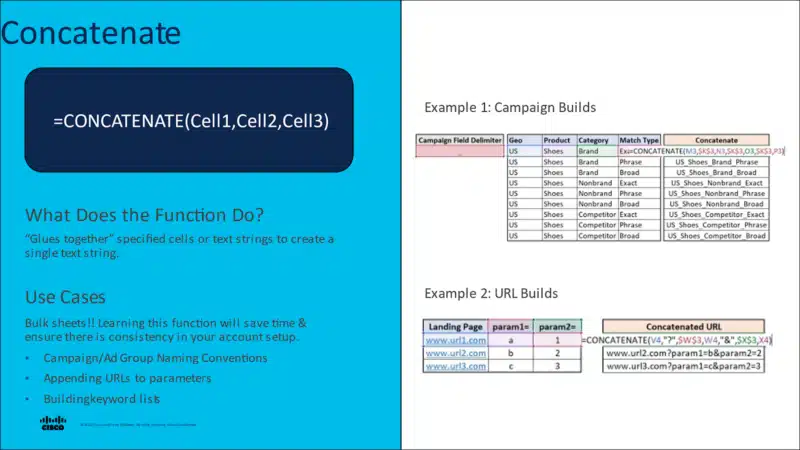
In terms of impact on day-to-day tasks, if CONCATENATE is not a part of your process when creating bulk sheets, this likely will be the most impactful takeaway from this article. This function allows users to combine the contents of multiple cells together in a single text string. Think of it like a glue that can be used to connect cells.
The applications of this function are far-reaching. One important note – the function is not limited to cells. Text/characters can be incorporated as fields within the formula using quotation marks around the text. Example 2 illustrates the incorporation of text into a CONCATENATE formula.
Excel 201: Preparing datasets for analysis
Pivot tables are a PPC marketer’s best friend. However, to best leverage pivot tables, you must invest time to ensure the integrity and granularity of the dataset.
The following functions/formulas included here are most impactful when preparing a dataset for analysis, but the applications are far-reaching.
VLOOKUP
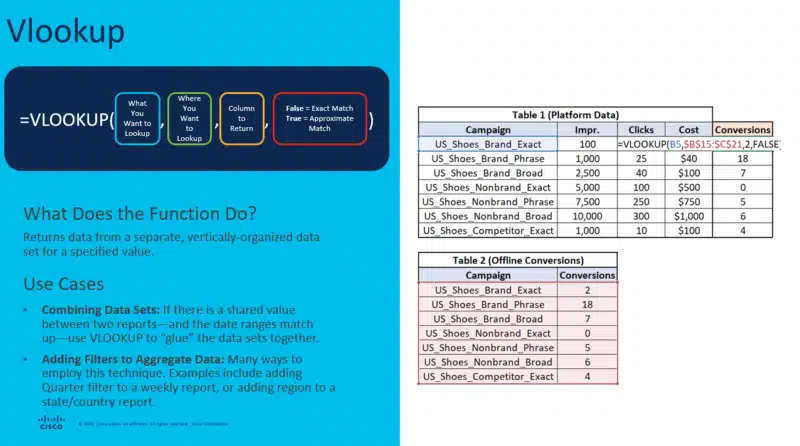
Some may argue that this is the most useful function for search marketers, and I would not put up a huge fight. VLOOKUP is a critical function for search marketers to master, as it’s common that datasets need to be augmented or modified with data from other platforms.
If “source of truth” reporting sits outside of the PPC platforms, you are likely familiar with the challenges of combining datasets. In addition, VLOOKUP is an easy way to add macro-level filters to a granular dataset.
A best practice I recommend is pulling data at the most granular level possible and using VLOOKUP to add filters easily. Start your analysis at higher levels and drill down to the biggest drivers of a change.
For example, if stakeholders ask for a breakdown of geographic performance, pull at the city level, build a table associating the cities to states and regions, and add two columns for State and Region to the dataset using VLOOKUP.
Transform date to week
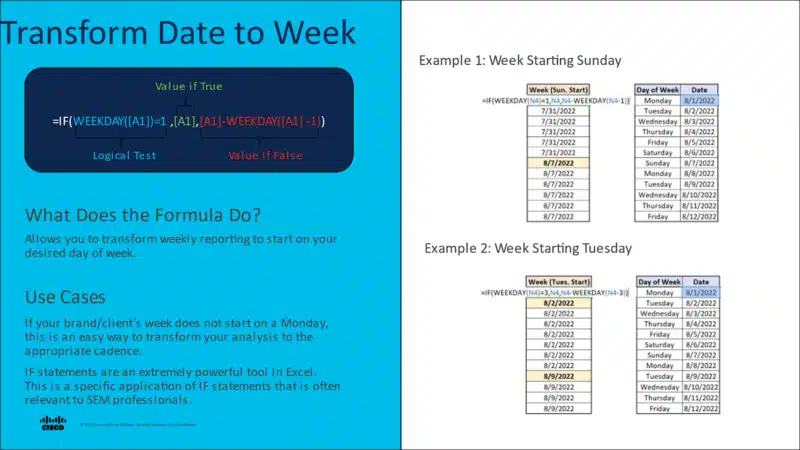
This IF statement is particularly helpful for PPC because weekly reporting options can be limited when pulling reports directly from the platform.
For brands or clients that do not have a traditional Monday to Sunday schedule, pull data at the day/date level. Then add a column to the dataset for Week using this formula.
Note that standard settings in Excel indicate 1=Sunday, 7=Saturday. In Example 2, I have used Tuesday as the start of the week.
Note that the day of week indicator needs to be updated in both the IF statement logic, as well as the returned value if false.
Excel 301: Tools for large-scale datasets
Categorization based on text
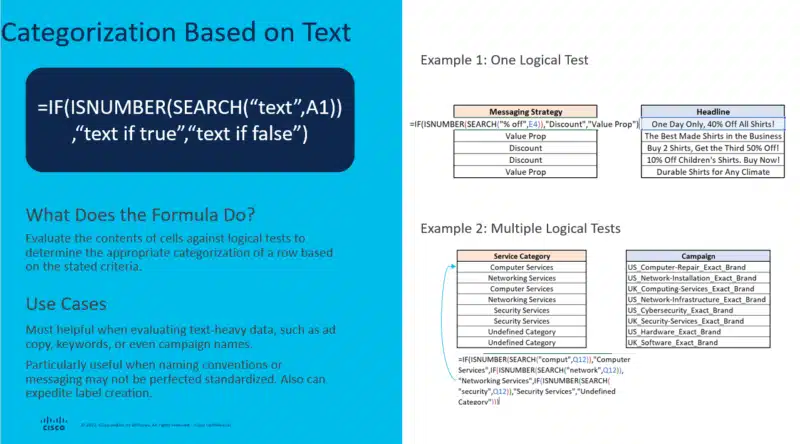
While it might be complex at first glance, this formula is very practical for search marketers. It allows users to search a cell of text for a particular word or phrase.
If the cell meets the criteria, the formula will return text inputted in the ‘text if true’ field. Based on the previous formula we covered, I bet you can guess what happens if it does not match.
The formula has many applications within search marketing. However, categorization is rarely binary – meaning you are not categorizing entities into one of 2 options.
Example 2 shows how multiple logical tests can be stacked on each other. This is referred to as a nested IF statement. To create a nested IF statement, you repeat the IF statement logic in the ‘text if false’ field with different search criteria.
Essentially, this tells Excel to search for the first phrase/text. If it does not find it, search for the second phrase/text. Using nested IF statements, advertisers can quickly categorize data at scale.
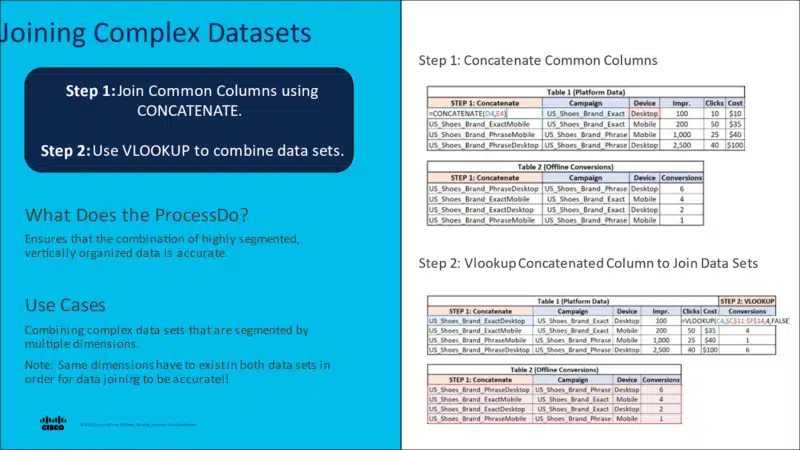
Joining complex datasets
Finally, I want to highlight how the techniques described previously can be leveraged collectively to enhance the quality of analysis.
If you’re following the best practice of pulling platform data at the most granular levels, it’s common for data to contain multiple segmentations (a.k.a., attribute columns in the dataset).
When combining data between two platforms, the datasets must have the same level of granularity. Otherwise, data that you pull into your original dataset will be inaccurate.
To join complex datasets, use CONCATENATE to create an additional column that joins together all segmentations in the original dataset. This should be replicated in the second dataset, using the same order in the concatenation. See Step 1 for an example.
The newly formed column now serves as the connector between the two datasets. Using the VLOOKUP function, search for this newly created column in the second dataset and designate which column of data you’d like to append to dataset #1. Double check the VLOOKUP worked correctly by comparing the sum of the newly imported data to the original table it was imported from.
Happy number crunching!
There’s a lot of information to digest here. Yet, we’ve only scratched the tip of the iceberg here.
Don’t give up if you’re struggling with Excel. It takes time to learn the functions and their capabilities. Search for some videos that walk you through live examples – those were particularly effective for me.
Opinions expressed in this article are those of the guest author and not necessarily Search Engine Land. Staff authors are listed here.
Related stories
About the author